
A client approached me with a large amount of data from multiple sources, including spreadsheets, databases, and cloud-based applications.
They needed to visualize and analyze this data in a way that was easy to understand and provided actionable insights. They also wanted to be able to update the dashboard regularly with new data.
The goal of the project was to
Determine the number of bookings and cancellations the hotel had monthly
Determine how many guests became repeat customers
Determine the food that was mostly purchased by guests at the hotel
Determine if most guests travelled alone/as a couple/with kids.
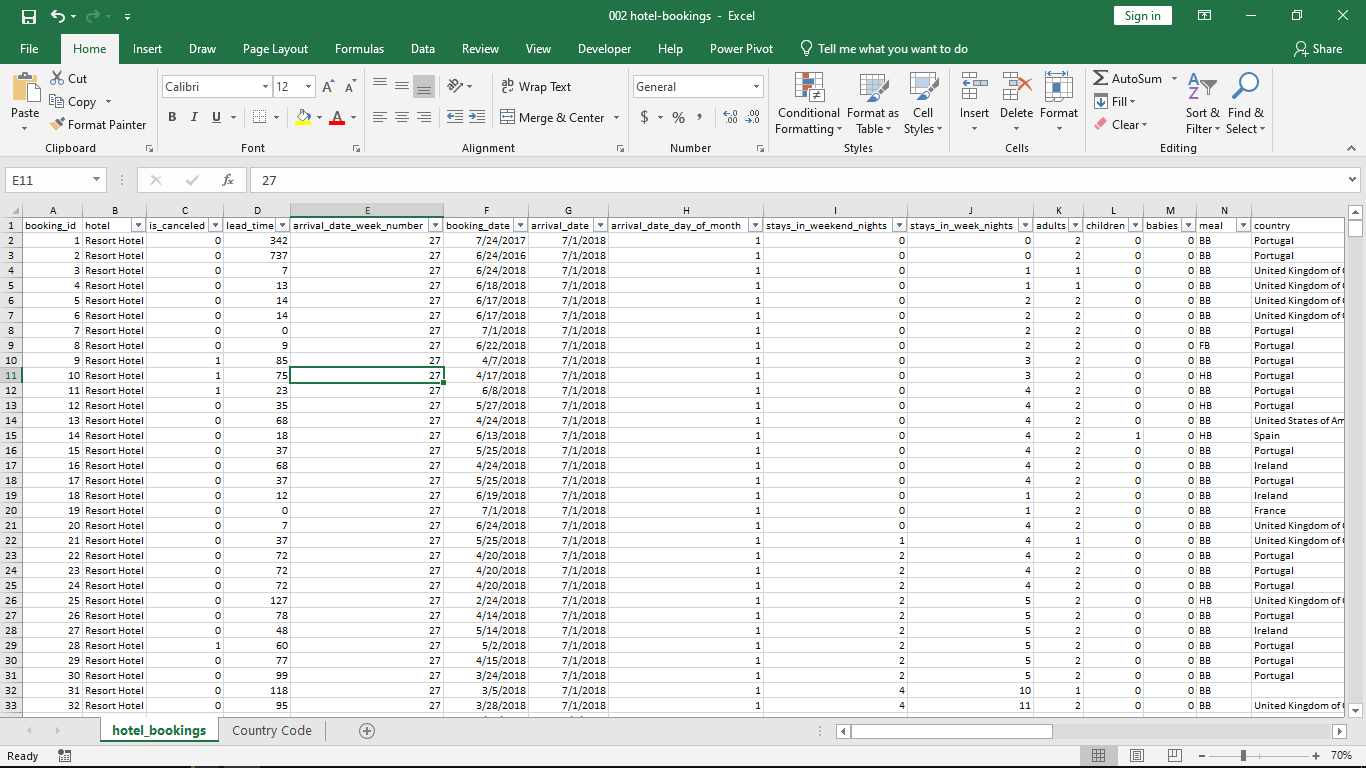
Excel file containing dataset
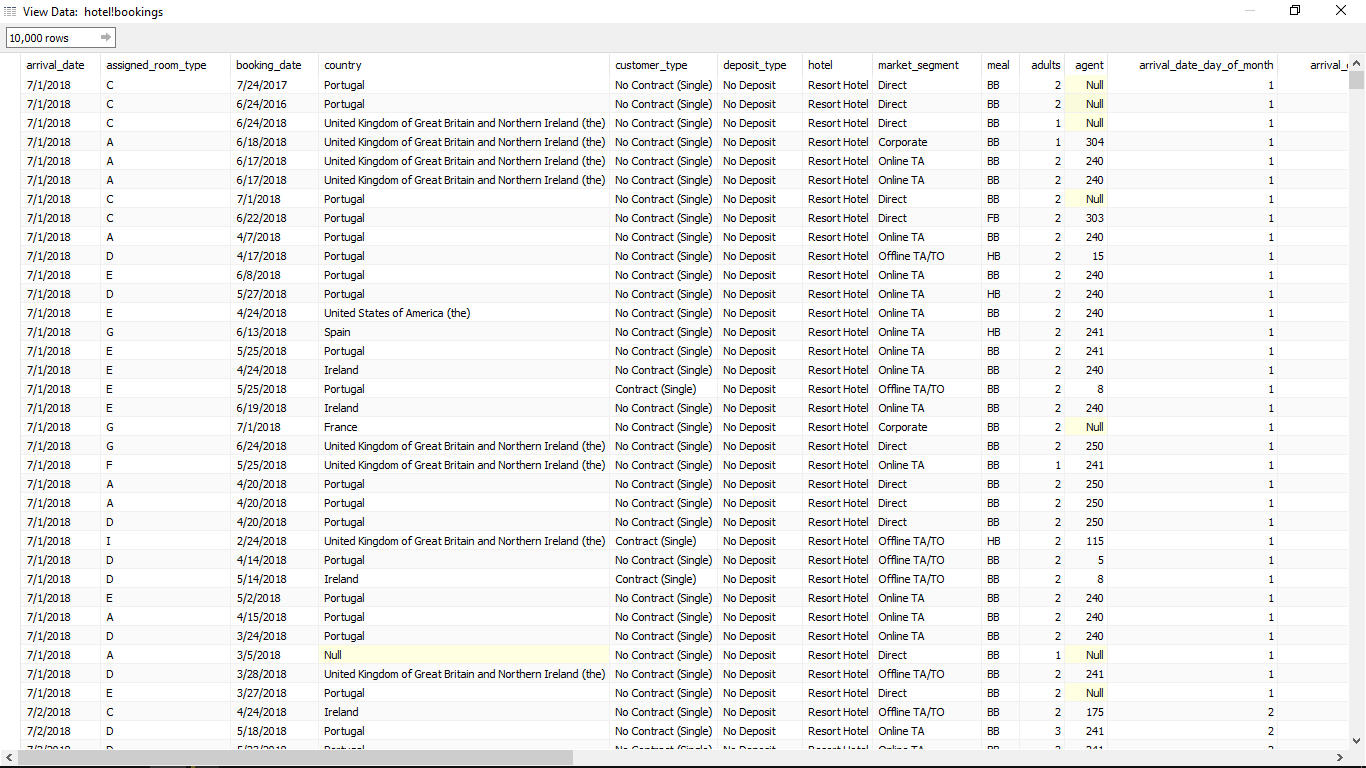
Loading Dataset into Tableau
Loading Dataset into Tableau
I worked closely with the client to create a Tableau dashboard that met their specific needs. The process began by cleaning and preparing the data, consolidating it into a single data model. and then creating custom visuals and interactive filters that allowed the client to explore the data in detail.
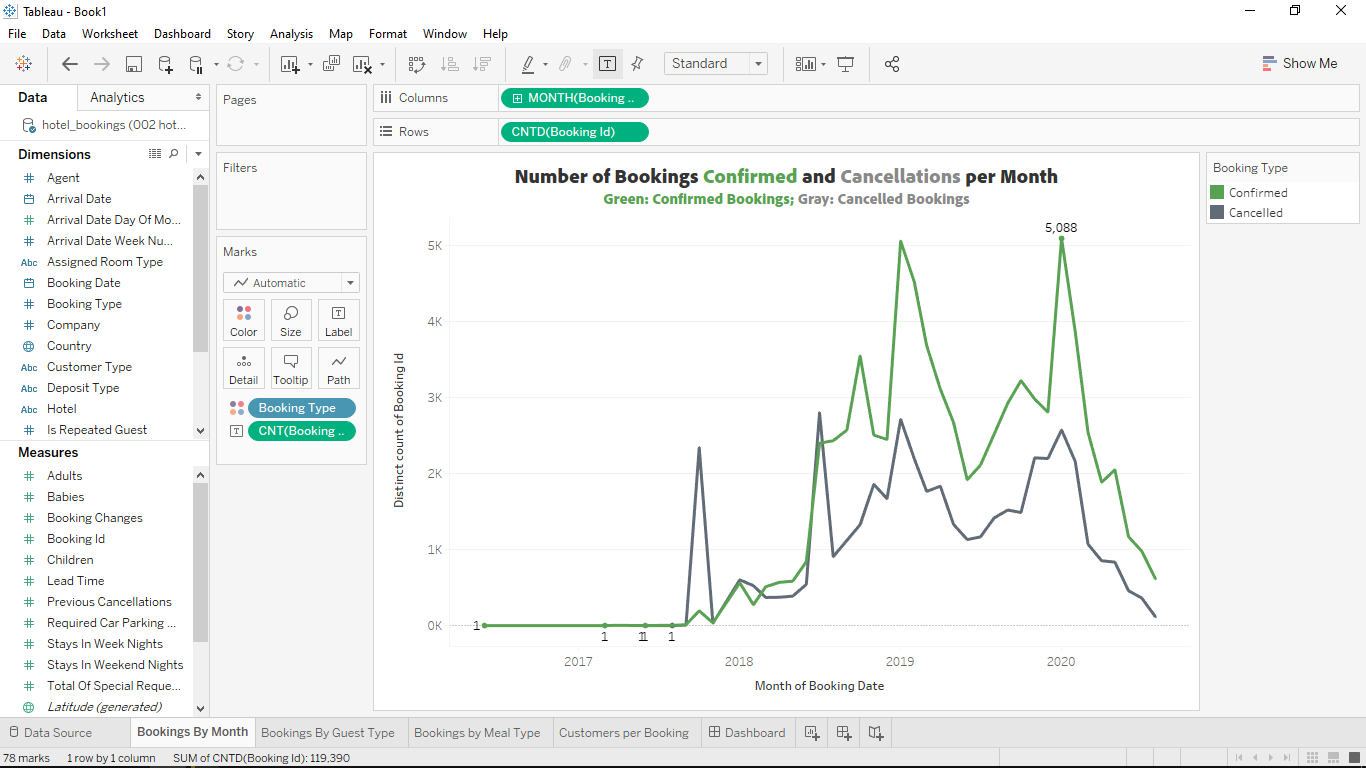
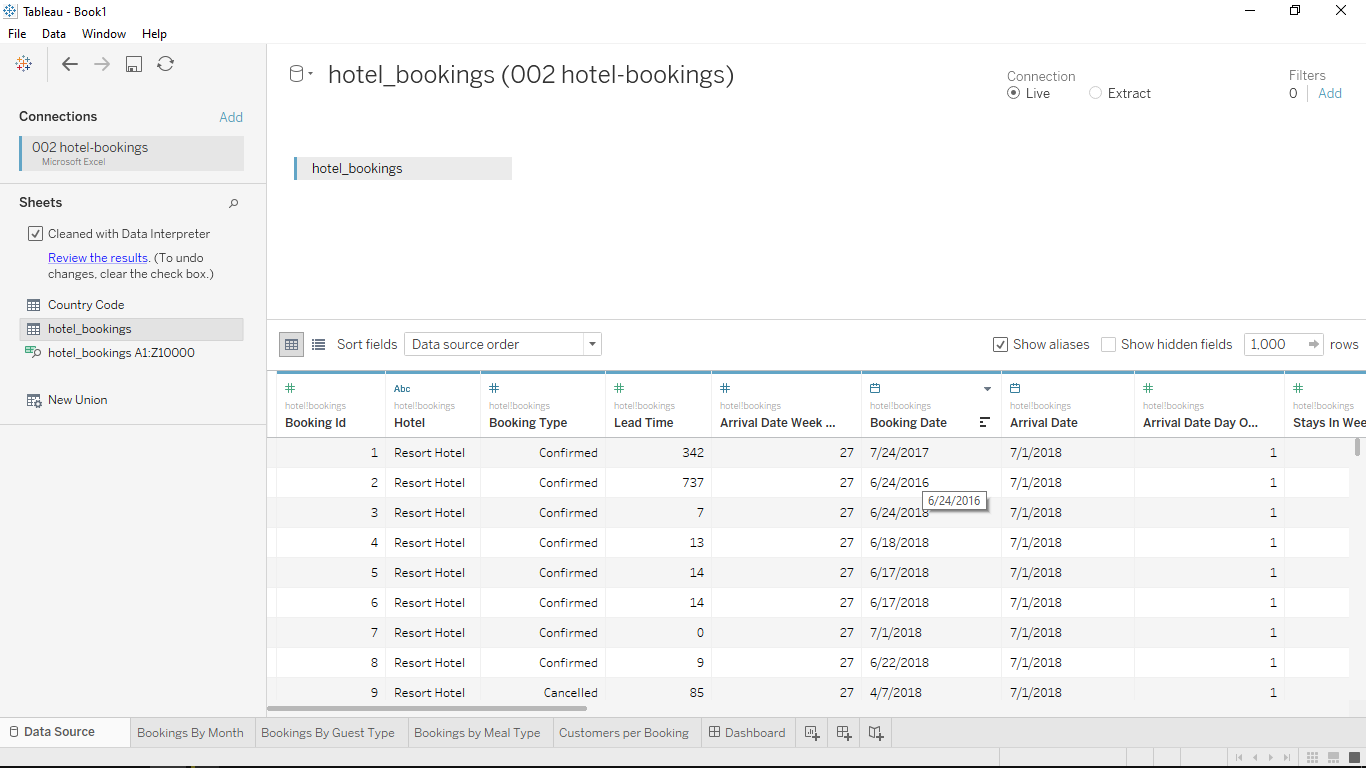
Tableau Data Visualization
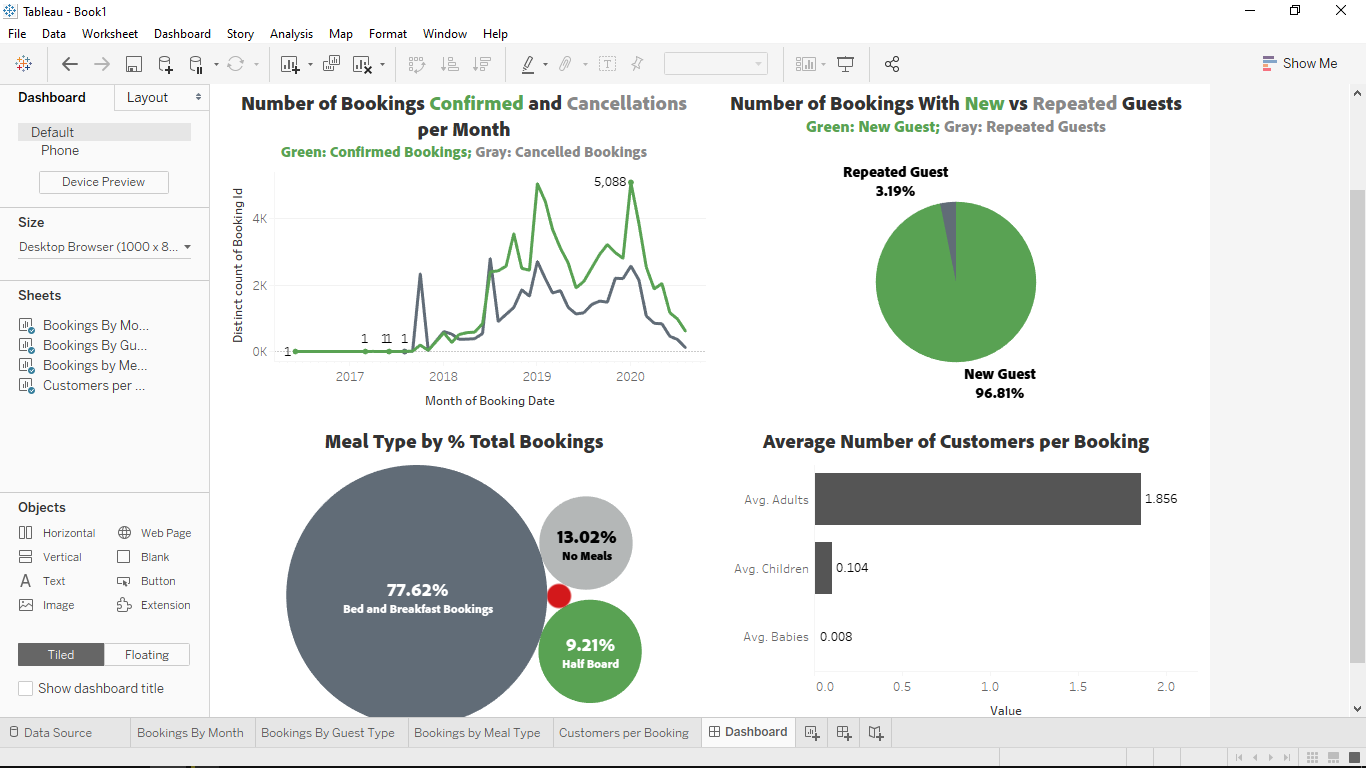
Dashboard Building
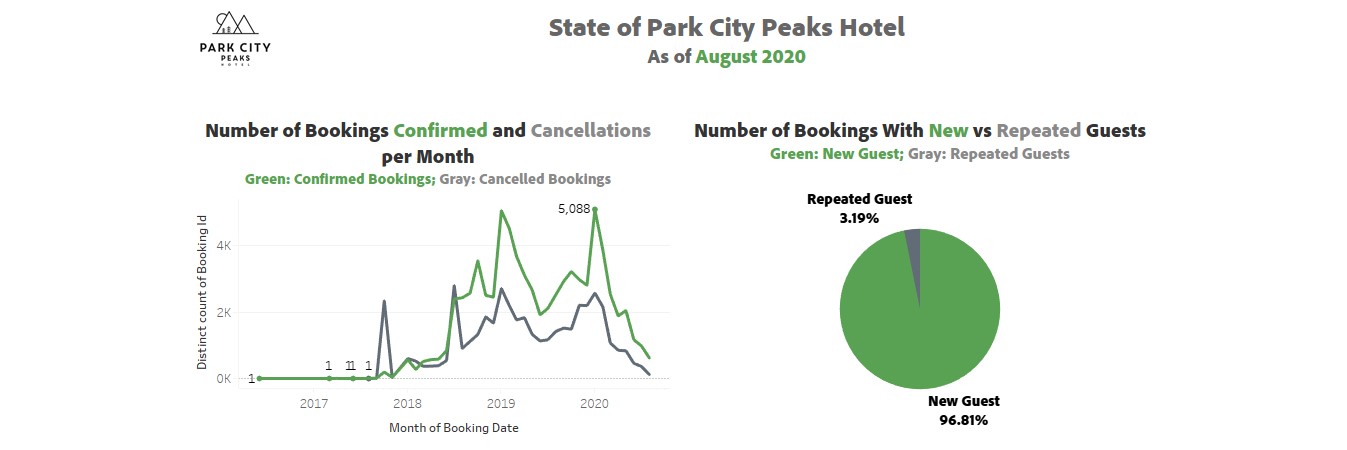
Final Dashboard
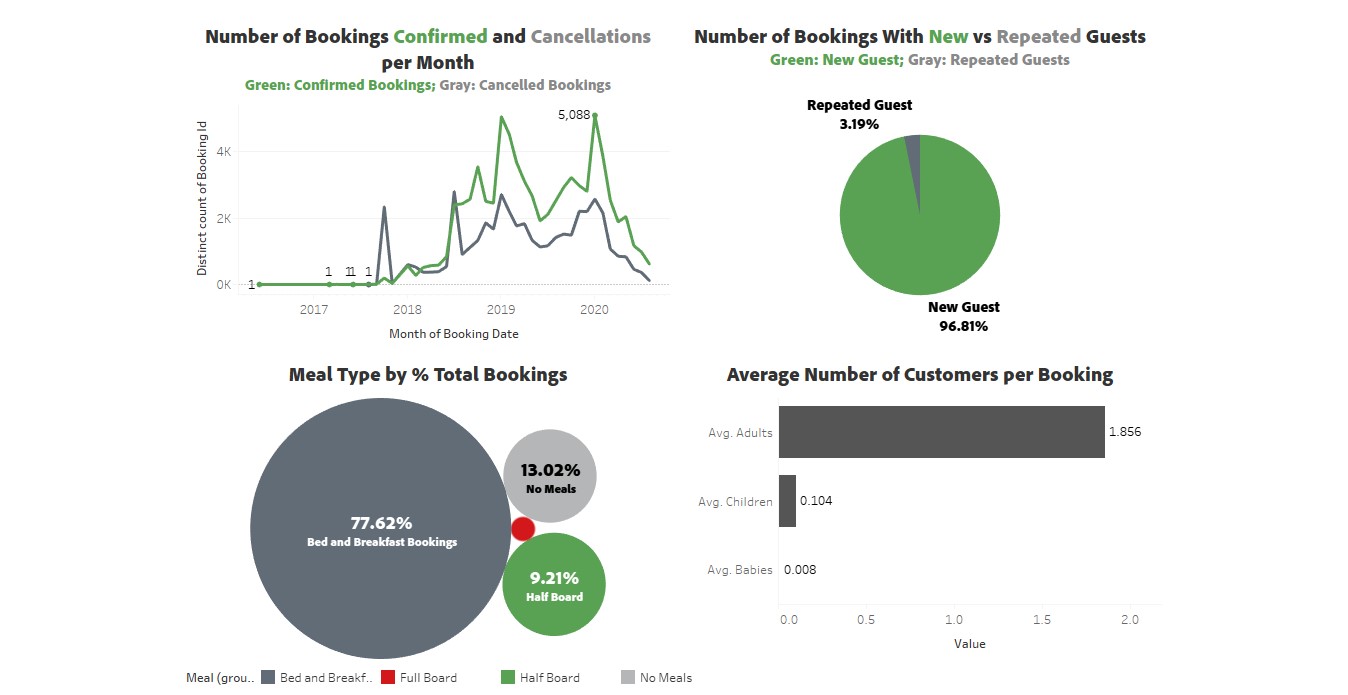
Final Dashboard
I'm happy to connect, listen and help. Let's work together and build something awesome. Let's turn your idea to an even greater product. Email Me.